What could make a smaller Dutch salary worth it?
Pay, employment rights, pace, commuting, stress, and everyday life: a practical comparison of tech work in the US and the Netherlands.
Updated
A lower Dutch offer can make a move look hard to justify on paper. If your reference point is Bay Area compensation, the gap may be substantial. A pleasant bike ride and a cheaper coffee will not pay the difference into your savings account.
Still, the question clients are weighing is bigger than a salary. They are trying to picture an ordinary week: the work, the journey home, the time and energy left for people they care about. As a San Franciscan now living in the Netherlands, I am interested in that whole picture. It deserves a careful look at the money and some room to imagine what daily life might feel like.
What would your week look like?
A profitable company with a steady product can offer a very different week from a startup trying to raise its next round. Ask about the team you would join: its deadlines, office days, and expectations outside working hours.
Put two actual opportunities side by side, including household costs and the journey to work. Get the arrangements you depend on in writing, especially where and when you would be expected to work.
Compare two real weeks.
Include office days, errands, travel, and time at home.

The work
Pay, responsibility, decisions, hours, and recovery.
The life around it
Home, travel, care, errands, friends, and time to yourself.
Choose a life you can actually picture
Plan a normal working week using the terms you have agreed.
How much pay would you give up?
My reference point is San Francisco, and I now approach that comparison from the Netherlands. For someone leaving a senior Bay Area engineering role, the pay cut can be substantial. Reported median total compensation is $350,000, rising to $475,000 at the upper quartile. Those packages combine base pay, annual stock value, and bonuses.
Dutch earnings are much lower across the wider economy. In 2025, the median gross hourly wage was €23.51, across full- and part-time employees and excluding special payments. Only 6% of employee jobs paid at least €100,000 a year including those payments. A senior role at a global tech company sits well above the earnings most people here live on.
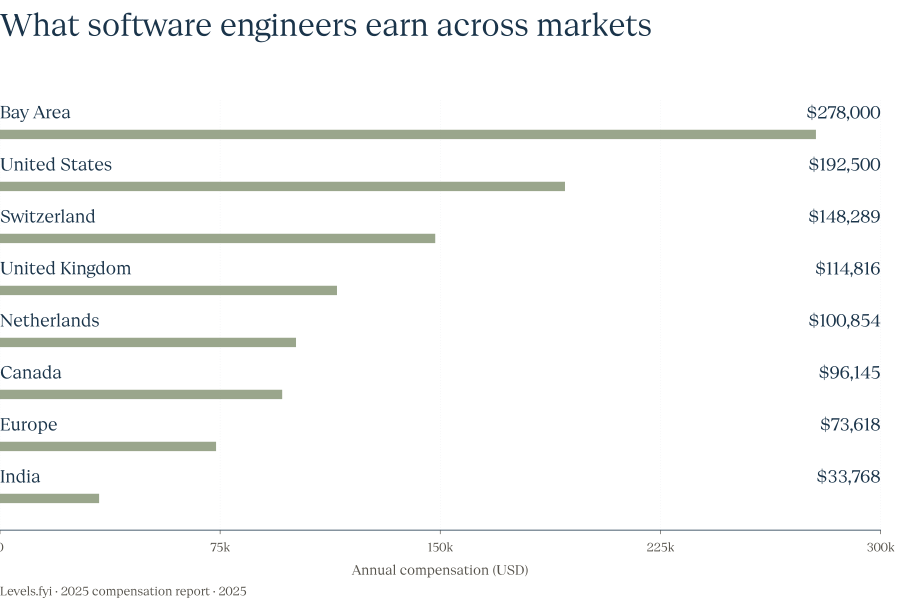
Across career levels, the 2025 reported median was about $101,000 in the Netherlands, compared with $278,000 in the Bay Area and $74,000 across Europe. Dutch tech pay can look strong within Europe and still feel like a substantial step down from San Francisco.
For an initial budget, I would test life on considerably less. My optimistic planning assumption is 60% of a comparable Bay Area package: $210,000 against $350,000, using the same currency. Even that would be a high Dutch package. Start below it and replace the assumption with actual offers.
Bay Area-level packages are possible in Europe, particularly in selected global technology and trading roles. Reported Uber staff packages in the Netherlands and Optiver's Dutch compensation are worth looking at if compensation is a priority. I would pursue those opportunities while keeping a more modest offer in the household budget until something is signed.
Living costs can be lower without falling nearly as far as compensation. Work out the reliable after-tax income first, then subtract the household bills. Keep uncertain equity out of the money available for rent.
Housing makes the tradeoff tangible. An 80 m² home might put you around €2,300 a month in Amsterdam, compared with roughly €1,600 in Eindhoven, before other household bills. These rough estimates use recent private-sector rents per square metre; individual homes will differ. Choosing where to live can change the budget substantially—but it also changes the journey to work, the people nearby, and the shape of an ordinary day.
Coffee might cost you about $4.80 in Amsterdam instead of $7 in San Francisco. Lunch could be much closer: around $23 versus $25. Utilities may even cost more. You can spend less on some everyday things and still find that housing, bills, and the occasional trip home take a larger share of your new salary.
Consider a simple illustration in one currency: take-home income falls from 10,000 to 6,000 a month, while spending falls 20%, from 5,000 to 4,000. Money left over falls from 5,000 to 2,000. The household spends less, but has 3,000 less available for saving each month.
After the calculations, return to a day you can picture. Where would you wake up, how would you get to work, and what could you do when the day ends? That is where the figures start to mean something. A lower monthly surplus may feel very different depending on the life it leaves you with.
What software engineers earn across markets


The Dutch reported median is about 36% of the Bay Area figure, while remaining above the European median.
Sources & calculation notes
Source: Levels.fyi · 2025 compensation report
Self-reported packages across levels; employer and seniority mixes vary by market.
- Population
- Reported software-engineer compensation across levels. Country, regional, and metro populations overlap; Europe is the report’s region, not the EU.
- Measure
- Published median annual total compensation in USD, including salary, stock, and bonuses. Regional medians are taken directly from the report; country values from its map.
- Source location
- Regional Breakdown: regionData stats (US, Canada, Europe, India), US cities (Bay Area), and mapData Europe country display values (NL, CH, GB). No worldwide aggregate is published in this comparison.
- Checked
| Group | Value |
|---|---|
| Bay Area | $278,000 |
| United States | $192,500 |
| Switzerland | $148,289 |
| United Kingdom | $114,816 |
| Netherlands | $100,854 |
| Canada | $96,145 |
| Europe | $73,618 |
| India | $33,768 |
Employment protections change the deal
Dutch employees have a statutory annual-leave minimum equivalent to four working weeks: 160 hours for a 40-hour week. Contracts can provide more. That Dutch minimum gives you a starting point when reading an offer. In the US, federal law does not require paid vacation, so the employer’s terms and applicable local rules matter more to that part of the comparison.
Dutch employers must follow the applicable legal grounds and dismissal procedures when ending employment. Candidates should understand those protections; founders need to allow for them in staffing decisions and budgets.
Know what you are trading.
Make the costs visible alongside the possibilities.

Protect
The conditions your household cannot compromise on.
Explore
The changes you would welcome and want to test.
Verify
The assumptions that still need a clear answer.
Know which tradeoffs you accept
Check what you can afford to give up and what you need in return.
Pace and pressure belong in the interview
I would ask a founder to describe the last missed deadline. Did the team reduce scope, move the date, bring in help, or simply work longer? That answer tells me more about pace than “we move fast.”
A demanding role can offer learning, responsibility, and momentum. It can also make family plans and recovery difficult. A steadier rhythm can protect attention, but some people will find a particular company's decisions too slow. Ask the team for an example of a recent deadline and how it was handled.
Work can still be exhausting here. In 2024, one in five Dutch employees reported feeling emotionally exhausted. A move will not resolve an overloaded role unless the way the work is managed changes too.
Test the commute from an address you could afford
A short distance on a map can become a long commute once you add a bus connection, a school drop-off, and a wait for the train. Before choosing a home, try the door-to-door journey on a normal working day.
Try the actual route at the actual time. Include walking to the station, connections, parking, and getting children where they need to be. A bicycle trip can combine transport and movement; weather and distance can make it less appealing. A train can offer reading time; transfers can remove its convenience.
The real return can be everyday freedom
For me, the strongest case for the Netherlands is the possibility of a day that takes less organising: children gaining independence, errands within walking distance, and time with people nearby. Those benefits deserve serious weight when deciding whether to accept a smaller salary.
The Netherlands remains a relatively high-trust society. About 63% of people said they trusted others in 2025, although that had fallen from 66% the year before. Trust is part of what makes sharing streets, neighbourhoods, and public space feel workable.
For families, independence can be part of the return: children playing nearby, walking to a friend's house, or eventually cycling to school without a parent accompanying every trip. Age, confidence, and the actual route matter. Streets designed for children to cycle independently make that freedom more practical.
Walkability is livability. Buying bread, meeting a friend, or reaching a park without organising a car journey makes room for spontaneity. For someone leaving a driving-heavy Bay Area routine, that can mean fewer logistics and less everyday vigilance. The value is having more room to exhale at the end of an ordinary day.
The portions may be smaller, and some familiar conveniences harder to find. You may miss them or prefer the change. The Dutch still have room for an all-you-can-eat buffet from time to time.
Choose the tradeoffs you can live with
| Dimension | Possible benefit | Tradeoff to test |
|---|---|---|
| More cash | Greater savings or flexibility | Local costs and the demands attached to the role |
| Protected time | Space for rest and family | Whether the team actually respects it |
| A different pace | A better match for your working style | How urgency, decisions, and ambition work together |
| A different commute | More movement or useful travel time | Housing costs, connections, and office frequency |
| Everyday services | Less household effort | Price, availability, language, and opening hours |
Before accepting, ask everyone in the household what they would miss and what they hope would improve. Put those answers beside the budget and the working arrangements. You may willingly give up some savings for more time, independence, or a job you want. It helps to know how much you are giving up, and what would need to be true for that choice to keep working.
For families making the move, the international schools guide compares school routes, fees, and locations before the housing search begins.
There is no need to decide which country wins. Try to picture a week you would be glad to repeat, then check what it would cost and what you would miss. The move becomes easier to consider when its pleasures and its compromises both have a place in the conversation.
About this essay
Based on client conversations, with identifying details omitted and examples adapted for clarity. The 60% figure is a budgeting assumption. The chart compares reported 2025 medians across career levels; the senior Bay Area figure in the text is a separate October 2026 reference. The everyday price examples come from a small crowdsourced sample, using the source’s September 2026 currency conversions. Links and figures were checked on 30 October 2026.